Learning on the Job: Using D3.js
I was looking at ways to improve my HTML rendition of Synder’s work, and one direction would be to replace some of the original figures with generated maps. A friend suggested to use the D3.js framework and it doesn’t seem all that difficult. Here is what I’ve learned so far.
1. Loading D3.js and map data #
Getting D3 is pretty simple; just add these to your page:
<script src="//unpkg.com/d3/dist/d3.min.js"></script>
<script src="//unpkg.com/topojson/dist/topojson.min.js"></script>
You need also map data. A good source is Natural Earth. For this demo, I’ve chosen the 1:10m land polygons map (download link). Unfortunately the Natural Earth data is in SHP format and I had to convert it to GeoJSON using an online converter. The end result is here.
2. Provide some space on page #
That’s the easiest part: just add a div to the page:
<div class="d3-test">
  <canvas id="map" width="500" height="500"></canvas>
</div>
3. Making the map drawing script #
You need some scripting to make the map and best is to put it in a separate file. The script of this page is in /d3/d3-test.js. Of course it has to be loaded on the page:
<script src="/d3/d3-test.js"></script>
Starting from the end, you have to load the GeoJSON data and, when loading finishes, invoke a function to draw the map:
let geojson = {}
//...
d3.json ('/maps/ne_110m_land.json')
  .then(function(json) {
    geojson = json;
    update();
  })
We also setup a few global objects:
- an SVG drawing context:
let context = d3.select('#map canvas')
  .attr("width", document.getElementById("map").clientWidth)
  .attr("height", document.getElementById("map").clientHeight)
  .node()
  .getContext('2d');
- a map projection; for this first example I’m going to use an orthographic projection:
let projection = d3.geoOrthographic()
  .rotate([70, -40]);
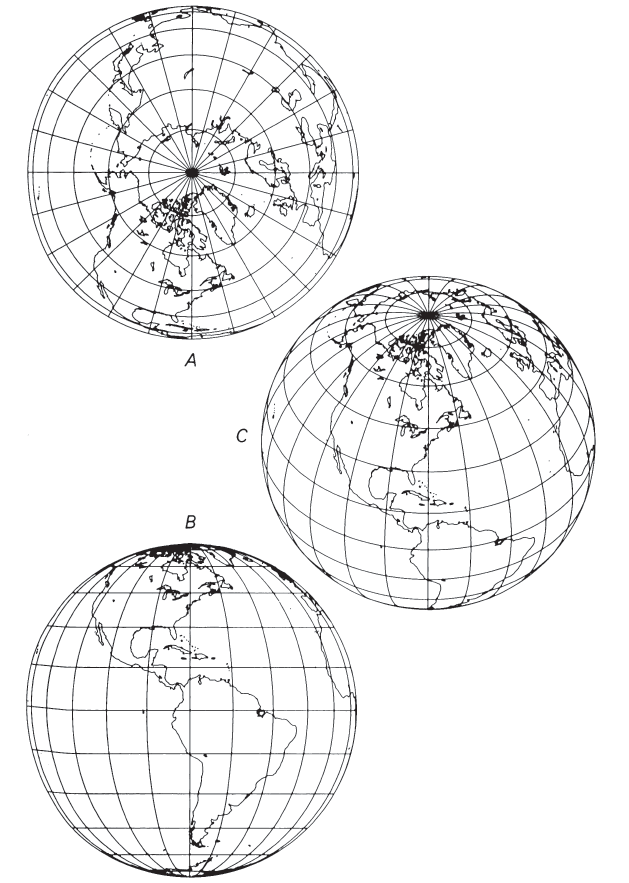
The above code also sets a reasonable scale, tilts the map down 40° and centers it on 70°W meridian to match Synder Figure 29(C).
- a geographic path generator. This is a function that will take the GeoJSON object and produce an SVG path:
let geoGenerator = d3.geoPath()
  .projection(projection)
  .pointRadius(4)
  .context(context);
The update() function (remember - this is invoked when GeoJSON data finishes loading) adjusts the position and scale to fit the GeoJSON data, and than uses the path generator to produce first the map the SVG path:
funciton update() {
  //...
  context.beginPath();
  geoGenerator({type: 'FeatureCollection', features: geojson.features})
  context.stroke();
  //...
and than the map graticule:
  //...
  context.beginPath();
  geoGenerator(graticule());
  context.stroke();
}
There are a few more functions that have to do with styling, but that’s the gist of it.
4. Changing the map theme #
To change the map appearance depending on browser theme (light or dark) we have first to determine the theme using the window.matchMedia() function. This function returns a MediQueryList object that will be used both to determine the current theme and to monitor for change notifications. Here is the code related to this:
let remove_change_notif = null;
//...
funciton update() {
  if (remove_change_notif != null) {
    remove_change_notif();
  }
  const media = matchMedia ("(prefers-color-scheme: dark)");
  media.addEventListener("change", update);
  remove_change_notif  = ()=>{
    media.removeEventListener ("change", update);
  };

  const isDark = media.matches;
Every time the theme changes, we have to create a new media query that returns a new MediaQueryList instance and install our update function as an event listener of the new MediaQueryLiat object.
Map stroke styling is changed based on current light theme as indicated by isDark flag.
5. My first map #
Below is the resulting image:
Compare it with the figure 29(C) from Snyder book:

6. The complete figure #
It’s time now to draw the whole figure from Snyder book:
Orthographic projection. (A) Polar aspect. (B) Equatorial aspect, approximately the view of the Moon, Mars, and outer planets as seen from the Earth. (C) Oblique aspect, centered at 40° N., giving the classic globelike view.